 |
 |
|
|
|
Reports, tables and graphs of water use can be prepared in an easily understood form. We use the same data collection, processing and reporting systems as all other regional Councils and government agencies, so any data can be easily transferred as required.
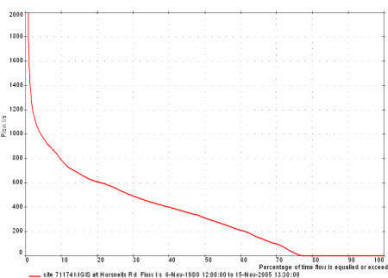
This graph shows the percentage of time when any specified flow rate was equalled or exceeded
This plot from our "Water Use" web page shows the flow rate within an irrigation race over the last 14 day period. The latest reading is shown at the top right of the plot. Consent details are shown at the bottom left of the plot. Other plots allow for 30 day flow rates, moving average volumes, and remaining seasonal volumes. Envelope plots are available for lake levels and groundwater bores.
|